

A manager at a West Coast tech company recently shared a sentiment I haven’t been able to shake:
“Collaboration is core to who we are. But I have no way to know if people are actually collaborating across departments. I have no data, just hope.”
That’s the whole problem in three sentences. She wasn’t confused about her values. She could recite them. They were on the wall, in the handbook, and on the careers page. What she couldn’t do was answer the only question that matters: is any of this actually happening?
Here’s the short answer to how you fix that. You measure core values by requiring every act of recognition to be tagged to a specific value, which turns each one into a structured behavioral record. Then you track five signals over time: coverage, which shows what share of your people have been recognized against each value; spread, which shows how evenly that activity is distributed across teams and locations; frequency, which shows how often each value appears and which direction it is trending; depth, which tells you whether the recognition names a specific behavior or simply says thanks; and correlation, which shows how value activity moves alongside eNPS, attrition, performance, and other outcomes the business already tracks.
That gives you five signals per value, refreshed continuously and sliceable by team, manager, and site. That’s the instrument. The rest of this piece is about how to build it.
Before getting into the mechanics, there is a simpler test you can run.
Pick the value leadership talks about most and ask two questions:
If you can answer those questions quickly, you already have the beginnings of a measurement system. If you can’t, that doesn’t mean your culture is broken. It means the behavior isn’t instrumented yet, which is a much more solvable problem.
There isn’t a credible industry estimate for how much large organizations spend specifically on “core values,” and I don’t think it helps to pretend there is. Companies don’t budget culture that neatly. The investment gets distributed across consulting engagements, executive workshops, employee research, leadership training, internal communications, employer branding, onboarding, engagement surveys, recognition programs, technology, and the countless hours leaders and employees spend participating in all of it.
What we do know is that the broader investment is substantial.
Harvard Business Review reported that organizations spend more than $100 billion annually trying to improve employee engagement. The larger point of that research was that many of those investments fail when companies treat engagement as a collection of programs rather than an expression of what the organization actually stands for.
The gap remains visible today. Gallup currently finds that only 20% of U.S. employees strongly agree they feel connected to their organization’s culture. Just 20% say their coworkers are committed to the organization’s cultural values, and only 19% strongly agree that their manager explains how those values influence the work.
Gartner reaches a similar conclusion from the leadership side. Culture is a major CHRO priority, yet less than half of CHROs say their current culture drives employee performance. Gartner also reports that only 48% of employees feel personally connected to their organization’s values and recommends that companies move beyond slogans and surveys by defining what values look like in everyday behavior and reinforcing them through the way work actually gets done.
Forrester provides an especially useful enterprise example. In a Total Economic Impact study commissioned by Workhuman, Forrester interviewed seven representatives from five organizations representing 430,000 employees. Those companies already had recognition practices in place, but adoption was low and their existing approaches provided limited reporting and visibility. Forrester’s modeled 50,000-employee organization generated $55.5 million in risk-adjusted benefits over three years after implementing a more structured recognition system, including $48.8 million associated with improved retention.
That is the part I find remarkable. The cultural intent already existed. Recognition programs already existed. The organization had already invested time and money. What was missing was a measurement layer capable of telling leadership whether the behaviors they had invested so much in defining and communicating were actually showing up.
The timing matters for another reason. In February 2026, Harvard Business Review published research from Ethan Rouen and Leigh Weiss on why some employee ownership programs produce results and others don’t. Their finding was that equity alone is insufficient, and the organizations that get returns pair it with three management practices: financial transparency, empathetic leadership, and rigorous measurement and management of culture. They also noted that companies without equity programs can replicate the results by applying the same three principles to bonuses, profit sharing, or career development.
The third practice matters. Not simply communication of culture or celebration of culture, but measurement and management.
HBR told a lot of executives to go measure their culture. It didn’t hand anybody an instrument.
There’s a definitional problem sitting underneath most conversations about culture measurement, and it’s worth resolving before we go further.
When leaders say they measure culture, they usually mean they run a survey that asks employees whether they agree with statements like, “I believe leadership lives our values.” That’s a measurement of sentiment about values. It’s useful. It’s also a different thing from measuring whether the values are actually being practiced.
Measuring core values means counting observable instances of value-aligned behavior, attributed to specific people, at specific times, in specific parts of the organization, and tracking how those counts change.
The difference shows up quickly. A sentiment measure tells you 68% of your people agree that accountability matters here. A behavioral measure tells you accountability was named in 1,240 recognitions last quarter, that 71% of them came from three departments, that your entire Western region contributed 22, and that your highest-coverage teams run 40% lower voluntary attrition than your lowest.
One of those numbers gets nodded at a leadership meeting. The other starts an argument, and arguments are where decisions come from.
This also explains why culture initiatives evaporate. You define values and communicate them, but then you have no mechanism for observing whether anything changed. The next meaningful check-in comes eleven months later when the survey comes back.
Values drift. Behavior drifts. In organizations with multiple sites, recent acquisitions, or fast headcount growth, that drift compounds before anyone notices. New employees never see enough live examples of what a value looks like. Department heads develop different working definitions of “excellence.” Senior leaders assume the values are being reinforced somewhere downstream.
Nobody is necessarily doing anything wrong. Nobody has enough evidence either.
This isn’t an argument against engagement surveys. Keep the survey. Just don’t ask it to do a job it wasn’t designed to do.
As a values instrument, it falls short in four critical areas.
Meanwhile, the underlying conditions keep getting harder. Gallup’s State of the Global Workplace: 2026 report found global employee engagement fell to 20% in 2025, its lowest level since 2020, costing the world economy an estimated $10 trillion in lost productivity. The manager picture is worse. The largest year-over-year drop in manager engagement occurred between 2024 and 2025, when it declined five points from 27% to 22%.
Managers used to be the transmission layer for culture. They’re now roughly as disengaged as the people they lead. If your only mechanism for keeping values alive is “managers will model them,” you’re relying on a layer of the organization that is quietly running out of gas.
You need a system that works even when a given manager isn’t at their best. That’s what infrastructure does.
Most organizations already generate values data every single day. They just throw it away.
Every time an employee thanks a colleague in Slack, that’s an observation about behavior. It has a giver, a receiver, a moment in time, and a reason. What it lacks is structure. Nobody tagged it to a value. Nobody can count it. Six weeks later it’s buried under 4,000 messages and it may as well never have happened.
Recognition run as infrastructure fixes that. Every recognition becomes a structured record containing:
That’s a behavioral event log for your culture. It is also one of the only continuous, employee-generated, time-stamped records of values-aligned behavior most companies will ever have. Instead of asking people to reconstruct what happened months later, you’re capturing what they chose to notice and reward in one another while the work was happening.
Madeline Des Jardins, Global Senior Director of Internal Communications and Employee Engagement at WalkMe, described what changes when that record exists:
“Instead of relying on memory, we can point to documented, values-based contributions throughout the year. It combats recency bias. We can say, ‘In March, you demonstrated ownership on this project. In July, you showed empathy during a difficult transition.’ It’s all there.”
That’s a performance management upgrade disguised as a recognition feature. Recency bias is one of the most persistent problems in performance review, and a values-tagged history quietly solves a good portion of it.
The relationship between consistent recognition and the outcomes executives care about is also well documented. The WorkProud Study 2024, a survey of 1,000 full-time workers across industries conducted by Rick Garlick, Ph.D., found that 59% of employees who report being consistently recognized fall into the high company pride segment, against just 13% of those who receive little or no recognition.
And pride, measured properly, predicts behavior that shows up in the P&L. In the same study, employees with high company pride were 36 times more likely than low-pride employees to strongly recommend their company as a place to work, 21 times more likely to say they’d happily spend the rest of their career there, and 15 times more likely to say they’d stay even if offered significantly more money elsewhere.
Fifteen to one is a meaningful number on the retention question that keeps CFOs awake.
Here’s the build. It takes roughly four to six months to reach a state where you have data worth acting on, and the sequence matters more than the speed.
This is where most organizations quietly fail before they start.
Values get inherited from the founding story, lifted from a competitor’s careers page, or workshopped by six people in a conference room. The output is a list of generic principles that don’t describe anything specific about working at your company.
You can’t measure “excellence” if nobody in your building agrees on what it looks like.
The organizations that get this right start by listening. Run focus groups across levels, functions, and geographies, then use a short survey to test whether the themes that surfaced actually hold at scale.
Ask one question and let it run:
Listen for the patterns underneath the answers.
One global tech company I’ve worked with went into this process assuming “innovation” was their defining value. What employees kept describing was something else entirely: clarity. People talked about understanding how their work connected to the company’s goals.
That discovery changed the entire design of their recognition system. They stopped celebrating novelty and started celebrating the people who explained connections, clarified decisions, and helped colleagues see the bigger picture.
The value became measurable because it finally described a behavior somebody could observe.
WalkMe ran a version of this in 2022 through an intensive global listening tour backed by more than twenty focus groups and an Organizational Health Survey that hit 87% participation in its first year. What came out of it were five values, the “WalkMe Way,” which then became the tagging structure for everything downstream.
You cannot skip this step. A measurement system built on values nobody recognizes will produce clean data about nothing.
A value is a noun. You can’t count nouns. You count verbs.
For every value, write down the specific, observable behaviors that would give you evidence the value is being practiced. Be concrete enough that two different managers would reasonably agree on whether they’d witnessed one.
A manufacturing firm attempting to elevate safety beyond basic compliance modeled this well. Their strongest safety leaders weren’t simply those who followed procedures. They were the people who actively spoke up about risks, coached peers on the floor, and mentored new hires through their first critical months.
| Value | Vague version | Observable behavior you can count |
|---|---|---|
| Collaboration | “Works well with others” | Pulled in a peer from another function to solve something outside their remit |
| Accountability | “Takes ownership” | Named a mistake before anyone asked and brought a fix |
| Excellence | “High standards” | Caught a defect or gap that would have reached the customer |
| Respect | “Treats people well” | Made space for a quieter colleague’s input in a decision |
| Growth mindset | “Always learning” | Taught a skill to a teammate or changed approach based on feedback |
Three to five behaviors per value is the right range. More than that and people struggle to remember them. Fewer and you’ll miss meaningful instances.
Then write those behaviors directly into your recognition interface as prompts. Don’t bury them in a training deck. Put them in the field where somebody is deciding what to recognize.
This is the operational step, and it’s where “we already do recognition” and “we measure our values” separate.
Four design requirements do the heavy lifting.
“When you put recognition tools in the hands of managers, you see the frequency and quality of recognition go up immediately.”
At WalkMe, every individual contributor receives 10 points a month and every manager receives 25, and the points expire at month end. Madeline calls the effect cyclical motivation. People go looking for good behavior before their points reset. The system trains attention.
Now you have data. Here’s what to actually look at.
Most recognition reporting stops at total volume, a vanity metric that confirms program usage but says very little about whether your values are actually alive. The following five signals do.
You don’t need to become a people analytics expert to use them. Start with five straightforward questions:
What percentage of your workforce has been recognized against each value in the last 90 days?
Run it per value, never only in aggregate. Aggregate coverage hides the failure mode. A company at 70% overall can easily be running 65% on collaboration and 4% on accountability, which means one of your stated values is barely visible inside the organization.
Low coverage doesn’t automatically mean employees aren’t demonstrating the value. It may mean people don’t know what the value looks like, managers aren’t reinforcing it, or the recognition process makes the behavior difficult to identify.
How evenly is recognition for each value distributed across teams, locations, functions, and levels?
Hunt for concentration. If 60% of your “innovation” recognitions come from product and engineering, you’ve learned that innovation reads as a technical value rather than a company value. That may be fine. It may also explain why your operations teams think it doesn’t apply to them.
Spread doubles as your manager diagnostic. Sort recognition given by manager and the distribution will often be more uneven than you expect. A small group usually accounts for most of the activity. Those are your champions. The long tail who have given nothing in 90 days becomes your intervention list.
How often does each value appear, and which way is the line moving?
Trend beats absolute volume. A value declining for two consecutive quarters is telling you something changed, and you can usually find plausible context: a reorganization, a leadership transition, a new priority, or a shift in how work gets done.
Webster Bank’s activity moved from 3,698 posts in 2023 to 13,416 in 2024 to 17,730 in 2025, with points awarded climbing from 52,525 to 254,358. That’s a program compounding instead of spiking and fading, which is the shape you want.
Is the recognition specific, or is it noise?
Two proxies work. Average values tagged per recognition tells you whether people are describing real behavior or clicking the first option. WalkMe’s 1.79 suggests the former.
Then read the written reasons.
“Thanks for everything” carries almost no behavioral information. “You stayed on the phone with that resident for 40 minutes after your shift ended” is evidence.
Sample a hundred by hand and you’ll learn more about program health than many dashboards will tell you.
How does value activity track against outcomes you already measure?
This is the signal that gets the program funded, and it means joining recognition data to something else: engagement scores, voluntary attrition, internal mobility, quality metrics, safety incidents, or customer satisfaction.
Start simple. Rank teams by recognition coverage. Pull attrition for the top quartile and the bottom quartile. If there’s a gap, you have the beginning of a business case. Run it again next quarter to see whether it holds.
You don’t need to start with a regression model. Start with a question your CFO already understands:
One caution is worth stating before somebody in the executive meeting states it for you: high-recognition teams tend to be well-managed teams, and recognition may be one of several things going right. Your credibility survives an honest caveat far better than an overstated claim.
Data that isn’t reviewed on a consistent schedule ceases to be a system and becomes reporting.
You don’t need another three-hour monthly meeting. You need a manageable rhythm.
The operational load is lighter than most people assume. Madeline oversees a global recognition ecosystem at WalkMe with 96.2% adoption, more than 12,100 recognition posts, and 66,707 total logins. Her time in the system:
“I probably spend 15% of my time in the system, and it enables me to do everything else that I want to do.”
Compare that with what a large values initiative can consume in meetings alone.
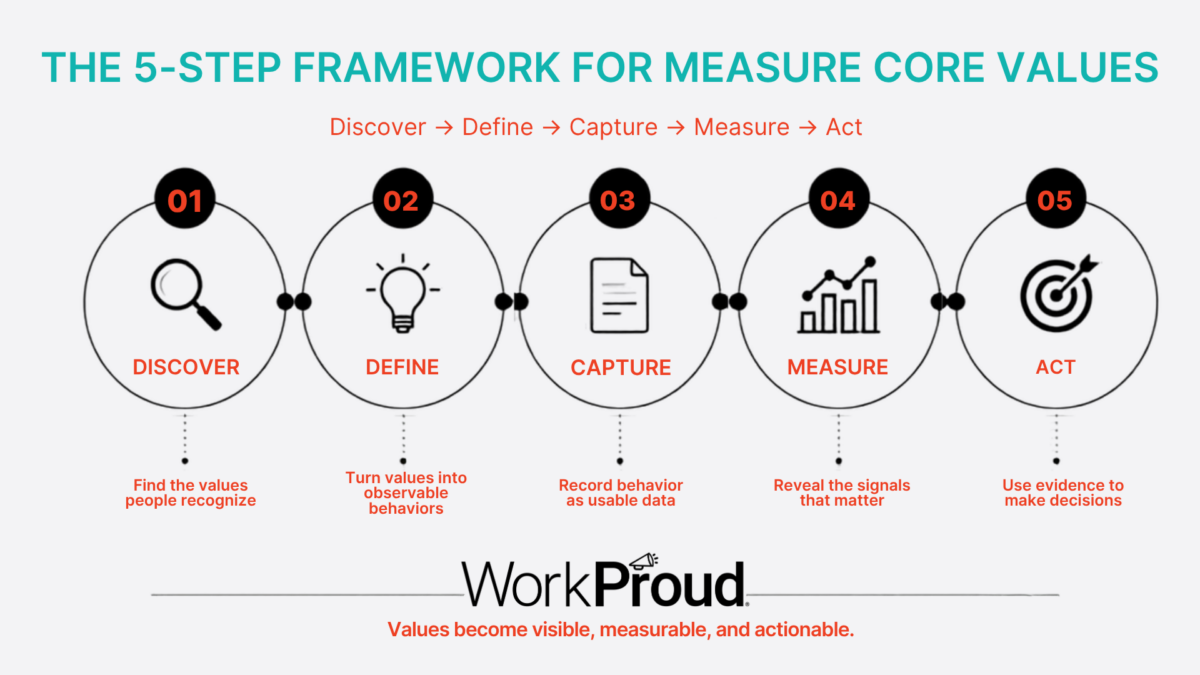
If you want the practical version of the entire framework, use this as the checklist. You don’t need a sophisticated people analytics organization to begin, but each step needs enough structure to support the one that follows.
| Step | What you need | The question to answer | What success looks like |
|---|---|---|---|
| Discover | Employee input across levels, functions, locations, and tenure; language people recognize; leadership agreement on what matters | Are these actually our values, or simply the words we’ve inherited? | Employees can explain a value in their own words and recognize it in real work |
| Define | Three to five observable behaviors per value; examples specific enough for managers to identify consistently | Could two people see the same behavior and agree on which value it demonstrates? | Someone can naturally finish the sentence, “I saw Accountability when…” |
| Capture | Required value tags; giver and recipient; timestamp; written reason; current organizational data; mobile access; one analyzable system | Does value-aligned behavior leave a usable record when it happens? | Recognition becomes structured behavioral data instead of disappearing into memory, email, or Slack |
| Measure | Coverage, spread, frequency and direction, depth, and correlation by value | Can we see which values are strong, weak, concentrated, fading, or connected to business outcomes? | You can identify a specific value, team, location, or manager that deserves attention |
| Act | Monthly operational review; quarterly leadership review; annual values review; clear owners for action | Does the data change anything we do? | Leaders use the evidence to coach, reinforce, invest, redefine a value, or make another concrete decision |
Pick one core value and answer five questions:
If you can answer all five, you’re measuring the value.
If you can’t, the missing answer tells you what part of the measurement system still needs to be built.
Frameworks are easy to write. Here’s what the data actually did at three organizations that ran this.
WalkMe is a digital adoption company with more than 1,000 employees across North America, EMEA, and APAC. When SAP acquired the company, the standard playbook would have predicted elevated voluntary attrition, particularly among high performers, and a slide in engagement through the integration period.
Before the partnership with WorkProud, recognition at WalkMe lived in a Slack kudos channel. There was no durable record, no tracking, and no reward attached. As Madeline described it:
“It wasn’t truly scalable because there wasn’t a record for people to go back to or review, and there was no reward tied to the recognition.”
In April 2024 they launched WalkProud, built on WorkProud, with values tagging required on every recognition. What the tracking showed across the 2022 to 2025 window:
Engagement improved during the acquisition, while voluntary attrition dropped by double digits year-over-year throughout the integration.
Madeline’s assessment captures the logic that resonates with a CFO:
“When you walk into an executive meeting, you can’t just say ‘people feel good.’ You have to show the impact. You have to connect recognition to engagement, to retention, to performance, and to business continuity.”
There were no retention bonuses or equity refreshes involved. Instead, the team relied on a measured, values-tagged recognition system and kept their workforce intact.
When Webster Bank merged with Sterling National Bank, they inherited two recognition approaches and two working definitions of what collaboration and accountability meant. One legacy organization relied on an existing recognition tool with mixed adoption. The other used emails, spreadsheets, and gift cards distributed by hand.
They launched STARS, a branded platform built on WorkProud, across all 195 branches simultaneously and connected it to their Human Capital Management System. Every recognition tags to one of six core values: Integrity, Collaboration, Accountability, Agility, Respect, and Excellence.
The activity data:
| Year | Recognition posts | Points awarded |
|---|---|---|
| 2023 | 3,698 | 52,525 |
| 2024 | 13,416 | 138,727 |
| 2025 | 17,730 | 254,358 |
In the annual employee engagement survey, overall scores improved by 3 points year over year, with the recognition-specific question showing a 5-point increase.
But the volume isn’t the interesting part. The interesting part is what the value tags revealed. Posts tagged to Collaboration showed team members from both legacy organizations working together, which is one of the hardest things to verify during an integration. Posts tagged to Integrity showed that colleagues shared a working understanding of what ethical behavior means in a regulated environment.
Every post became evidence of whether the merger was actually merging.
There was a compliance dividend too, which nobody plans for and everyone appreciates. Every recognition event logs automatically with full details of recipient, sender, reason, and reward value, and reports generate in seconds. Audit prep stopped being a spreadsheet archaeology project.
Joyce Murray summarized the cultural outcome:
“It gave us a common language right away. No matter where you came from, recognition was something we could all share.”
Gables Residential manages hundreds of apartment communities. Most of the workforce doesn’t sit at a computer: leasing consultants, maintenance technicians, and community managers spread across sites.
Before the program, recognition happened at an annual awards event that reached about 140 people. After launching a mobile-first system built around their core values, annual recognitions passed 11,000.
That’s roughly 78 times the reach, but the more important shift is what the data began capturing. Instead of measuring which employees leadership noticed at year end, Gables started measuring which behaviors colleagues valued in one another every week.
The funding detail is worth putting in front of a skeptical CFO. The program was paid for by reallocating the budget of the old once-a-year awards dinner. There was no new expense line. It was a reallocation and a design decision.
Measurement is only half the return. The other half is what becomes possible when leaders can see culture with enough resolution to act on it.
There’s a persistent misread in how organizations think about incentives. Programs get built for top performers, or for the bottom decile who need coaching. The largest untapped group sits in the middle, and it’s most of your workforce.
A meta-analysis by Condly, Clark, and Stolovitch, published in Performance Improvement Quarterly, screened roughly 600 studies and qualified 45. The average effect across all incentive programs was a 22% gain in performance. Programs running longer than six months averaged 44%. Team-directed incentives markedly outperformed individually directed ones. Duration and structure mattered more than the size of the award.
Coverage and spread data is what makes targeting the middle possible. It shows you who has never been recognized and where they sit.
That list is often dominated by steady contributors in less visible functions. They’re not underperforming. They’re invisible, and sustained invisibility is where quiet disengagement can begin.
Start by looking at:
Don’t turn that into a punishment list. Treat it as a visibility list and ask why.
Christi Gilhoi, an employee experience executive who has led global recognition programs at scale, described a technique that works better than a mandate:
“I like to use positive peer pressure. We put leaderboards up showing which departments are doing recognition well. Then we show: here are their eNPS scores, much higher. Here are their attrition scores, much lower. In change management, that’s when you feel the change curve start to work. The grouchy sideliners won’t come along first. But when they see their peers doing this and getting results, they can’t resist.”
The sequencing matters. A leaderboard alone is gamification, and people see through it. A leaderboard paired with engagement and attrition numbers is evidence. Evidence is much harder to argue with than a directive from HR.
Start with the champions, understand what they’re doing differently, and make those practices visible to the rest of the organization.
Most milestone programs celebrate the calendar. Year one, year five, year ten. Certificate, email, done.
Madeline pushed back on that directly:
“The longer we’re in it, milestones just aren’t the key factor in recognition anymore. It’s not about your physical presence. It’s about what you’ve accomplished and who you are.”
Her fix is co-creation rather than automation:
“You don’t have to do it for someone. You can do it with someone.”
That turns a service anniversary into a moment where actual contributions get named and gives you another values-tagged data point.
Structure the early milestones too. Ahmed El Bossati, Head of Culture and Capability at PepsiCo, uses a 30-30-30 approach to onboarding: connection through day 30, calibration and values-in-context through day 60, and celebration and individual strengths through day 90.
Recognizing people at those marks instead of waiting a year builds compounding moments during the period when employees are still deciding what the culture actually rewards.
Continuous values data surfaces gaps that are difficult to see any other way.
Maybe collaboration is core and your data shows almost no recognition for cross-functional work. Maybe accountability is a stated value that rarely gets named. Maybe leadership development is a priority and mentoring appears in under 1% of recognitions.
Every one of those observations is actionable in a way a broad survey result often isn’t. You can redefine the value, change how you talk about it, retrain managers on what it looks like, or accept that it doesn’t apply to the business the way leadership thought it did.
Sometimes the data tells you the value is weak. Sometimes it tells you the value is badly defined. Both are useful answers.
What you can’t do anymore is not know.
The stakes rise sharply where work is physically demanding, largely invisible, and expensive to backfill: healthcare, manufacturing, retail, and logistics.
The WorkProud 2024 healthcare data is stark. Twenty-three percent of healthcare workers reported receiving no recognition in the past month, against 18% in non-healthcare industries. Only 10% said they’d stay in their role if offered more money elsewhere.
Ryan Costella at the Wayne County Airport Authority, which runs Detroit Metro, described the operational math on a deskless workforce:
“About 70% of our workforce is deskless. From police to maintenance, they don’t clock in from a cubicle. When they feel recognized, they don’t just show up. They do the job 10% better. And that means less overtime, fewer headcount needs, and higher retention.”
He also described a language change that reoriented his managers:
“We told our managers, go look for someone doing something right. That flipped everything. It really opened our eyes to how much good stuff was already happening that we just weren’t capturing.”
That last phrase is the thesis of this article. The behavior was already there. Nobody was capturing it.
Any measurement approach that only comes with upside is being sold to you. Here are the real limits and how to work around each.
If you’re evaluating platforms against this framework, the feature list matters less than seven capabilities.
You need required value tagging on every recognition using your value names rather than generic categories. You need reporting at the value level that can be sliced by team, site, manager, and function. You need mobile access that works for people without a desk, distributed budgets so managers can recognize without an approval queue, HRIS integration so your organizational structure stays current, one system that holds recognition, milestones, and incentives together, and exportable data so people analytics can join it to attrition and performance.
This is where I’ll be direct about what we do. WorkProud unifies recognition, rewards, milestones, onboarding, and communication into one system, which is what makes the correlation analysis in Signal 5 possible at all.
The bigger difference is operational. Most platforms hand you a login and leave adoption to your team. We embed Certified Recognition Professionals who co-own launch, measure adoption, and stay accountable for outcomes past go-live. Client retention sits at 96%.
What it won’t do is fix values nobody believes in, compensate for leaders who don’t participate, or produce a clean causal proof that satisfies an econometrician.
Sofrida Saraswati, Head of People and Culture at Burson, named the failure mode precisely:
“If the people leader isn’t demonstrating it, then I don’t believe the program’s gonna land well. And if it’s not tied to values, then it’s just gamification.”
She’s right. The measurement system tells you the truth about your culture. It doesn’t change the truth by itself.
Require every recognition to be tagged to a specific core value, which converts each one into a structured record with a giver, recipient, timestamp, and written reason. Then track five signals per value: coverage, which measures the share of employees recognized against it in 90 days; spread, which measures how evenly recognition is distributed across teams and sites; frequency and direction, which track volume and trend; depth, which evaluates the specificity of the recognition; and correlation, which examines how value activity moves alongside engagement, attrition, and performance.
Review the data monthly at the operational level and quarterly with leadership.
Useful metrics include per-value recognition coverage, distribution across teams and locations, average values tagged per recognition, the percentage of managers who gave recognition in the last 90 days, and the attrition gap between your highest and lowest coverage teams.
Total recognition volume is one of the least useful metrics for determining whether a specific value is alive, and it’s the one many programs report first.
Yes, and at better behavioral resolution. Surveys capture sentiment once or twice a year. Values-tagged recognition data captures behavior continuously and can be segmented by value, team, manager, and location.
Most organizations get the strongest picture by running both: the survey for sentiment benchmarking and recognition data for diagnosis and intervention.
Four to six months is a reasonable timeline for reaching a first meaningful dataset. Discovery runs six to eight weeks, behavior mapping and system design four to six, platform selection two to four, and pilot through launch another six to twelve.
Usable trend data can emerge by month four. A more defensible correlation analysis generally requires more history.
Between four and six is usually workable. Below four, you’re often describing something too broad to guide behavior. Above six, coverage per value can thin out to the point where signal becomes harder to distinguish from noise, and employees struggle to name them.
WalkMe runs five. Webster Bank runs six.
The correlation analysis does.
Coverage and spread are operating metrics for the HR team. The board-level version is the relationship between values activity and retention, engagement, and performance stability, expressed in dollars where possible.
Deloitte’s 2025 High-Impact Total Rewards research found that high-maturity rewards organizations were 3.1x more likely to optimize ROI on rewards investments and posted 55% higher three-year earnings per share than low-maturity peers.
That’s the language the room is already speaking.
Retrofit it. Turn on required tagging, map your values into the categories, and treat your first two quarters as a baseline rather than a verdict.
Tagged coverage usually stabilizes around month three.
Pick your most important value.
Now try to answer this:
If you can answer that in under five minutes, you already have much of the infrastructure you need and should be running the other four signals against it.
If you can’t, you’ve found the gap. The behavior you care about may already be happening across the organization every week. You simply don’t yet have a reliable way to see it.
That manager on the West Coast had the right instinct and no way to act on it. Hope isn’t a measurement strategy, particularly after an organization has already invested significant money, executive time, and employee attention deciding what its culture is supposed to stand for.
The next step isn’t another poster or another values workshop. It’s creating enough evidence to know whether the behaviors you said mattered are actually happening.
If you’re trying to make your values measurable, or you’re staring at a recognition program that produces activity reports and no evidence, talk to us.
No pitch deck. Just a conversation about what you’re actually trying to prove.

10-Step Guide for building inspired Company cultures.
If you want to see what the modern version of each capability looks like in one platform, talk to WorkProud’s team. Bring your engagement survey; the tenure question is usually where the conversation gets interesting.
Lorem ipsum dolor sit amet, consectetur adipiscing elit. Ut elit tellus, luctus nec ullamcorper mattis, pulvinar dapibus leo.

WorkProud is committed to helping its clients create a unified approach to the employee experience by helping them build cultures of workplace pride. Trusted by millions of users at some of the world’s most recognized employer brands, WorkProud delivers a comprehensive approach to building company cultures that inspire people to be Proud of their Work and Proud of their Company.
Here you will find insights curated for leadership seeking in-depth industry knowledge. Explore comprehensive studies, helpful guides, and expert white papers.
*By selecting “VIEW RESOURCES,” you agree to WorkProud’s Privacy Policy. You may unsubscribe from our emails at any time. Please note when unsubscribing: it may take up to 10 business days for your request to take effect.
An icon of style from Hollywood to hip-hop, the Wayfarer never stands still. Forever embraced by the next generation of culture makers, now its journey continues with AI-enhanced wearable tech. Ray-Ban Meta Wayfarer enables you to live in the moment and share how you see the world. Listen, call, capture and livestream features are seamlessly integrated within the classic frame. Eye size: 50; Frame: Matte Black; Lens: Clear/Graphite Green Transitions; Lens Material: Standard Plastic
Color: Matte Black/Clear-Graphite Green Transitions
A
Afghanistan
Albania
Algeria
Andorra
Angola
Antigua & Deps
Argentina
Armenia
Australia
Austria
Azerbaijan
B
Bahamas
Bahrain
Bangladesh
Barbados
Belarus
Belgium
Belize
Benin
Bhutan
Bolivia
Bosnia Herzegovina
Botswana
Brazil
Brunei
Bulgaria
Burkina
Burundi
C
Cambodia
Cameroon
Canada
Cape Verde
Central African Rep
Chad
Chile
China
Colombia
Comoros
Congo
Congo {Democratic Rep}
Costa Rica
Croatia
Cuba
Cyprus
Czech Republic
Denmark
D
Djibouti
Dominica
Dominican Republic
E
East Timor
Ecuador
Egypt
El Salvador
Equatorial Guinea
Eritrea
Estonia
Ethiopia
F
Fiji
Finland
France
G
Gabon
Gambia
Georgia
Germany
Ghana
Greece
Grenada
Guatemala
Guinea
Guinea-Bissau
Guyana
H
Haiti
Honduras
Hungary
I
Iceland
India
Indonesia
Iran
Iraq
Ireland {Republic}
Israel
Italy
Ivory Coast
J
Jamaica
Japan
Jordan
K
Kazakhstan
Kenya
Kiribati
Korea North
Korea South
Kosovo
Kuwait
Kyrgyzstan
L
Laos
Latvia
Lebanon
Lesotho
Liberia
Libya
Liechtenstein
Lithuania
Luxembourg
M
Macedonia
Madagascar
Malawi
Malaysia
Maldives
Mali
Malta
Marshall Islands
Mauritania
Mauritius
Mexico
Micronesia
Moldova
Monaco
Mongolia
Montenegro
Morocco
Mozambique
Myanmar
M
Namibia
Nauru
Nepal
Netherlands
New Zealand
Nicaragua
Niger
Nigeria
Norway
O
Oman
P
Pakistan
Palau
Panama
Papua New Guinea
Paraguay
Peru
Philippines
Poland
Portugal
Q
Qatar
R
Romania
Russian Federation
Rwanda
S
St Kitts & Nevis
St Lucia
Saint Vincent & the Grenadines
Samoa
San Marino
Sao Tome & Principe
Saudi Arabia
Senegal
Serbia
Seychelles
Sierra Leone
Singapore
Slovakia
Slovenia
Solomon Islands
Somalia
South Africa
South Sudan
Spain
Sri Lanka
Sudan
Suriname
Swaziland
Sweden
Switzerland
Syria
T
Taiwan
Tajikistan
Tanzania
Thailand
Togo
Tonga
Trinidad & Tobago
Tunisia
Turkey
Turkmenistan
Tuvalu
U
Uganda
Ukraine
United Arab Emirates
United Kingdom
Uruguay
Uzbekistan
V
Vanuatu
Vatican City
Venezuela
Vietnam
Y
Yemen
Z
Zambia
Zimbabwe